


Texas Tech Review: How Bad Did We Really Get Beat, and What's Going on with First Down?
Taking a look at advanced stats to see how much, if at all, ASU was outclassed by Texas Tech, and examining the offense's first down balance.

Did we really get beat that bad?
Every week, Parker Fleming (@statsowar on X.com) of College Football Insiders posts a couple of charts titled “Did We Really Get Beat that Bad?”, and “Did We Really Get Beat that Bad? Remix”:
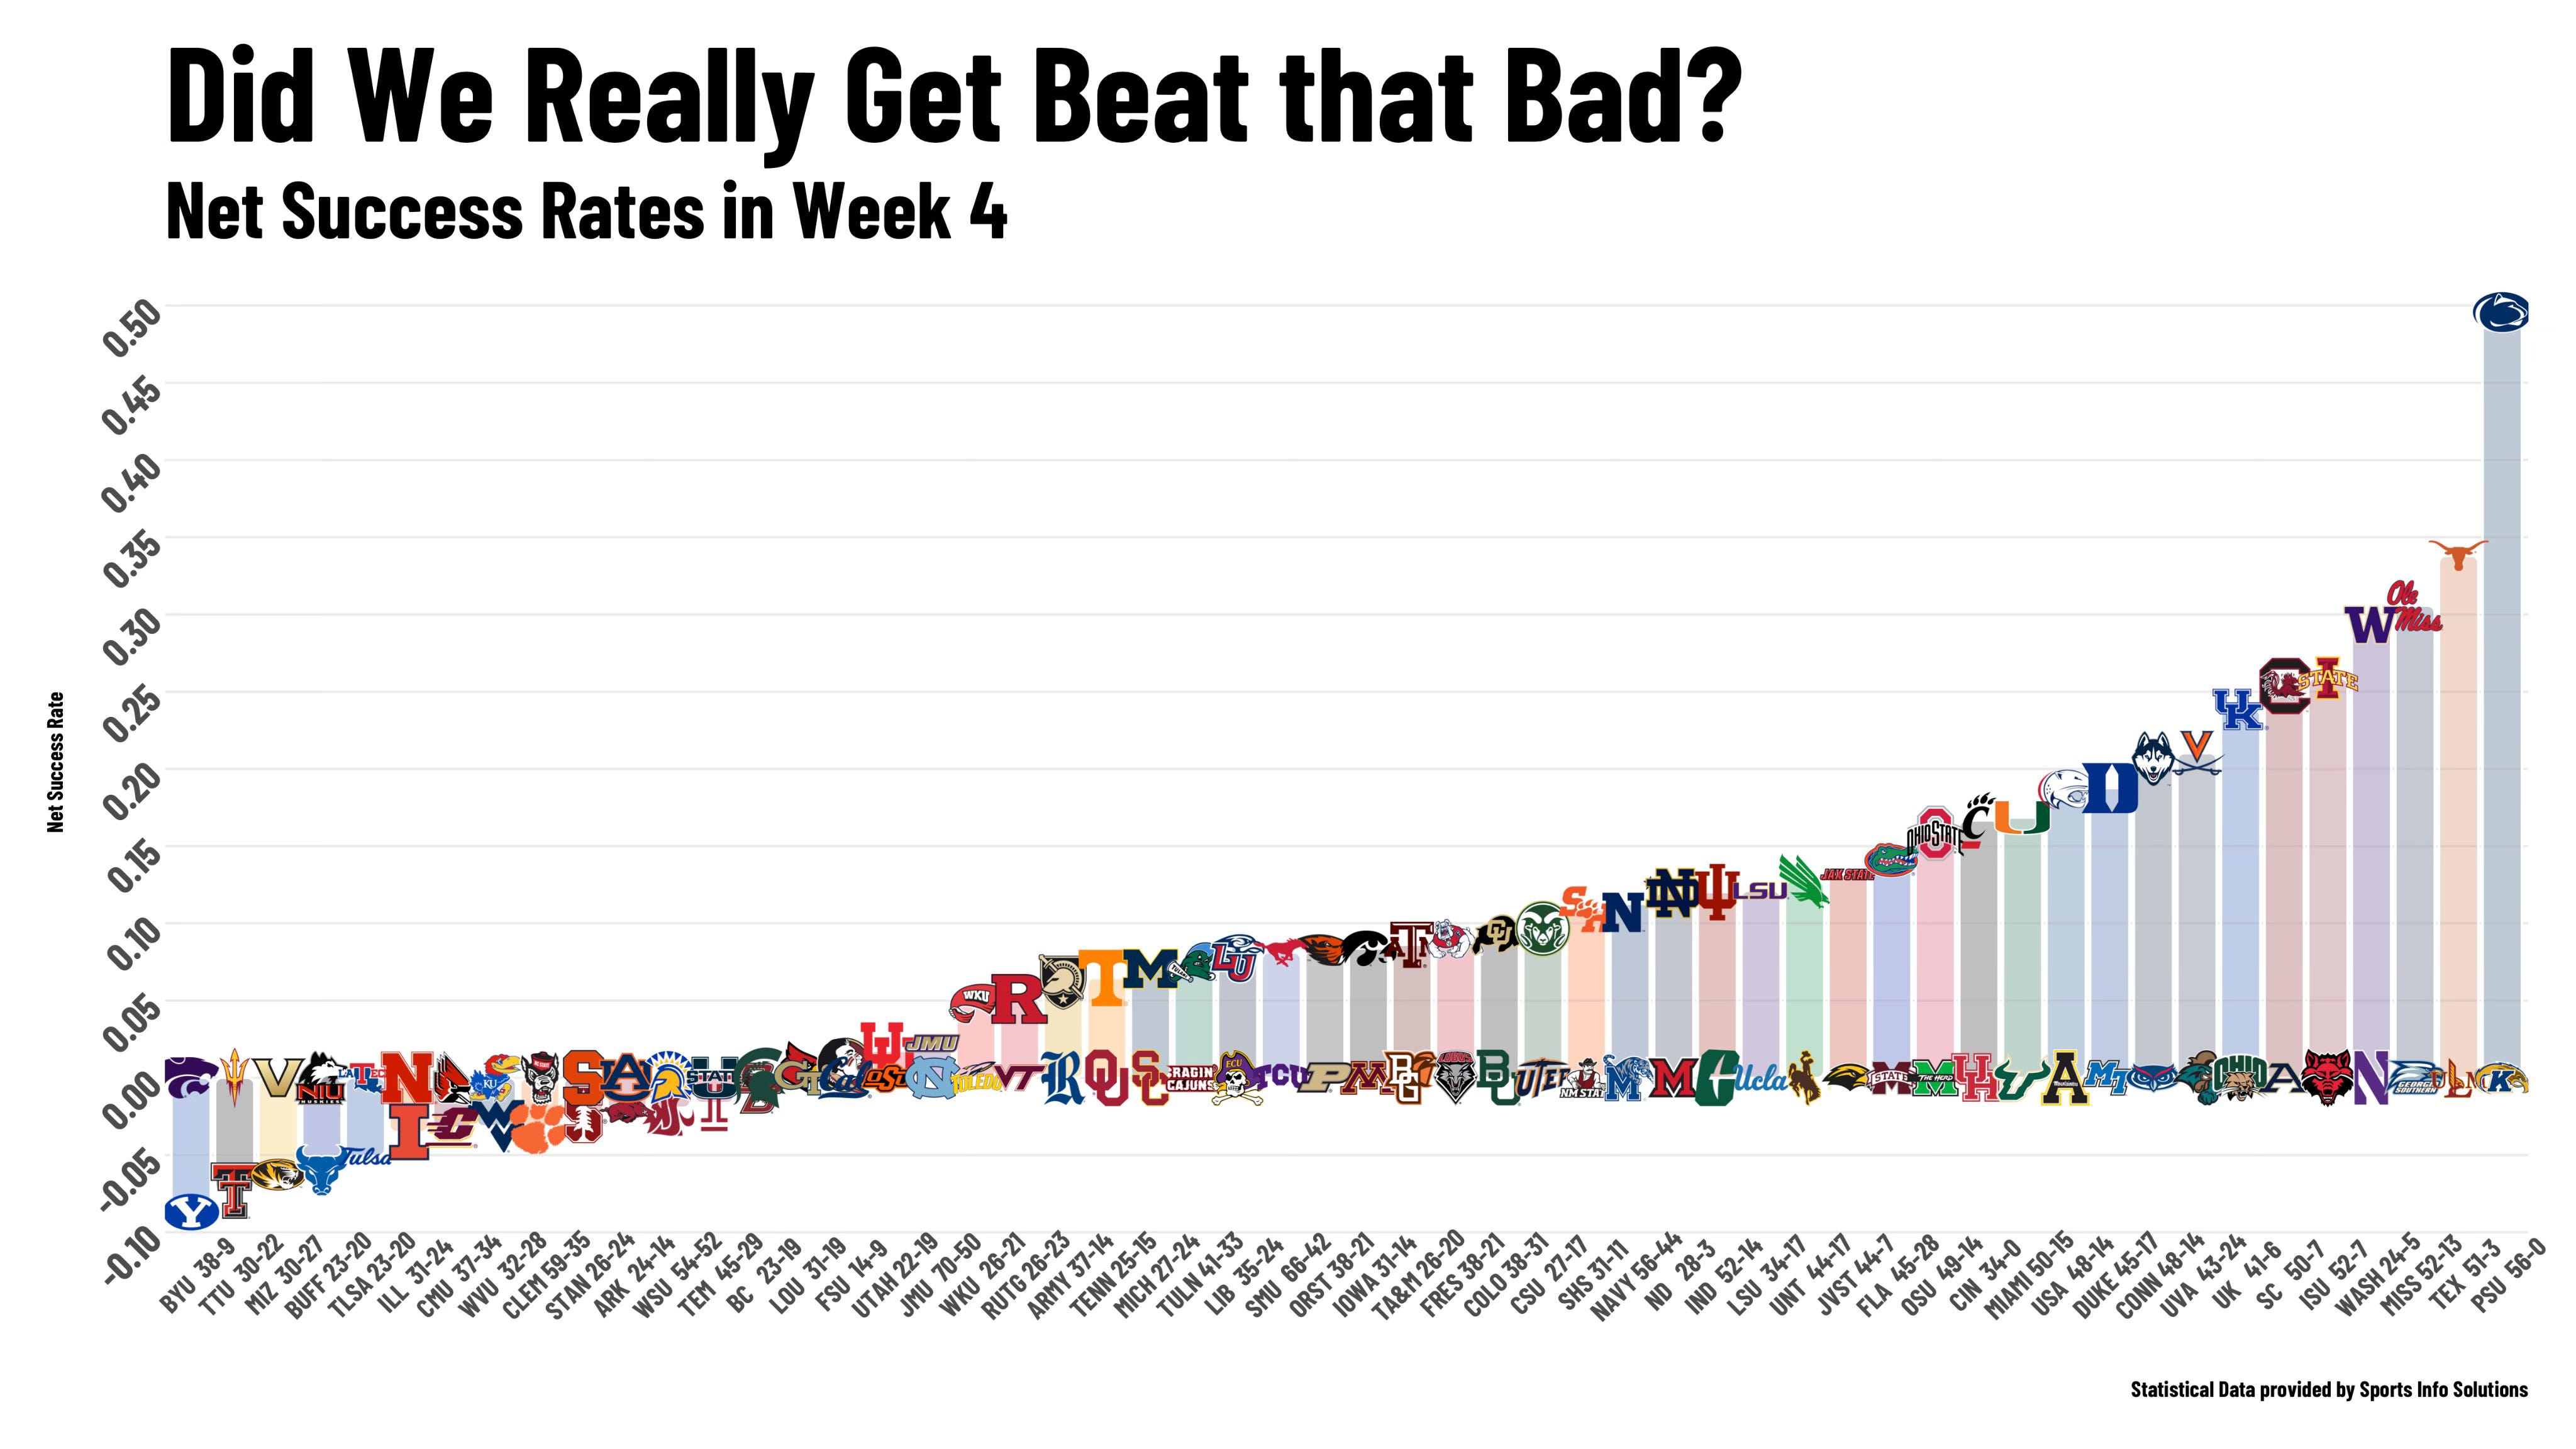
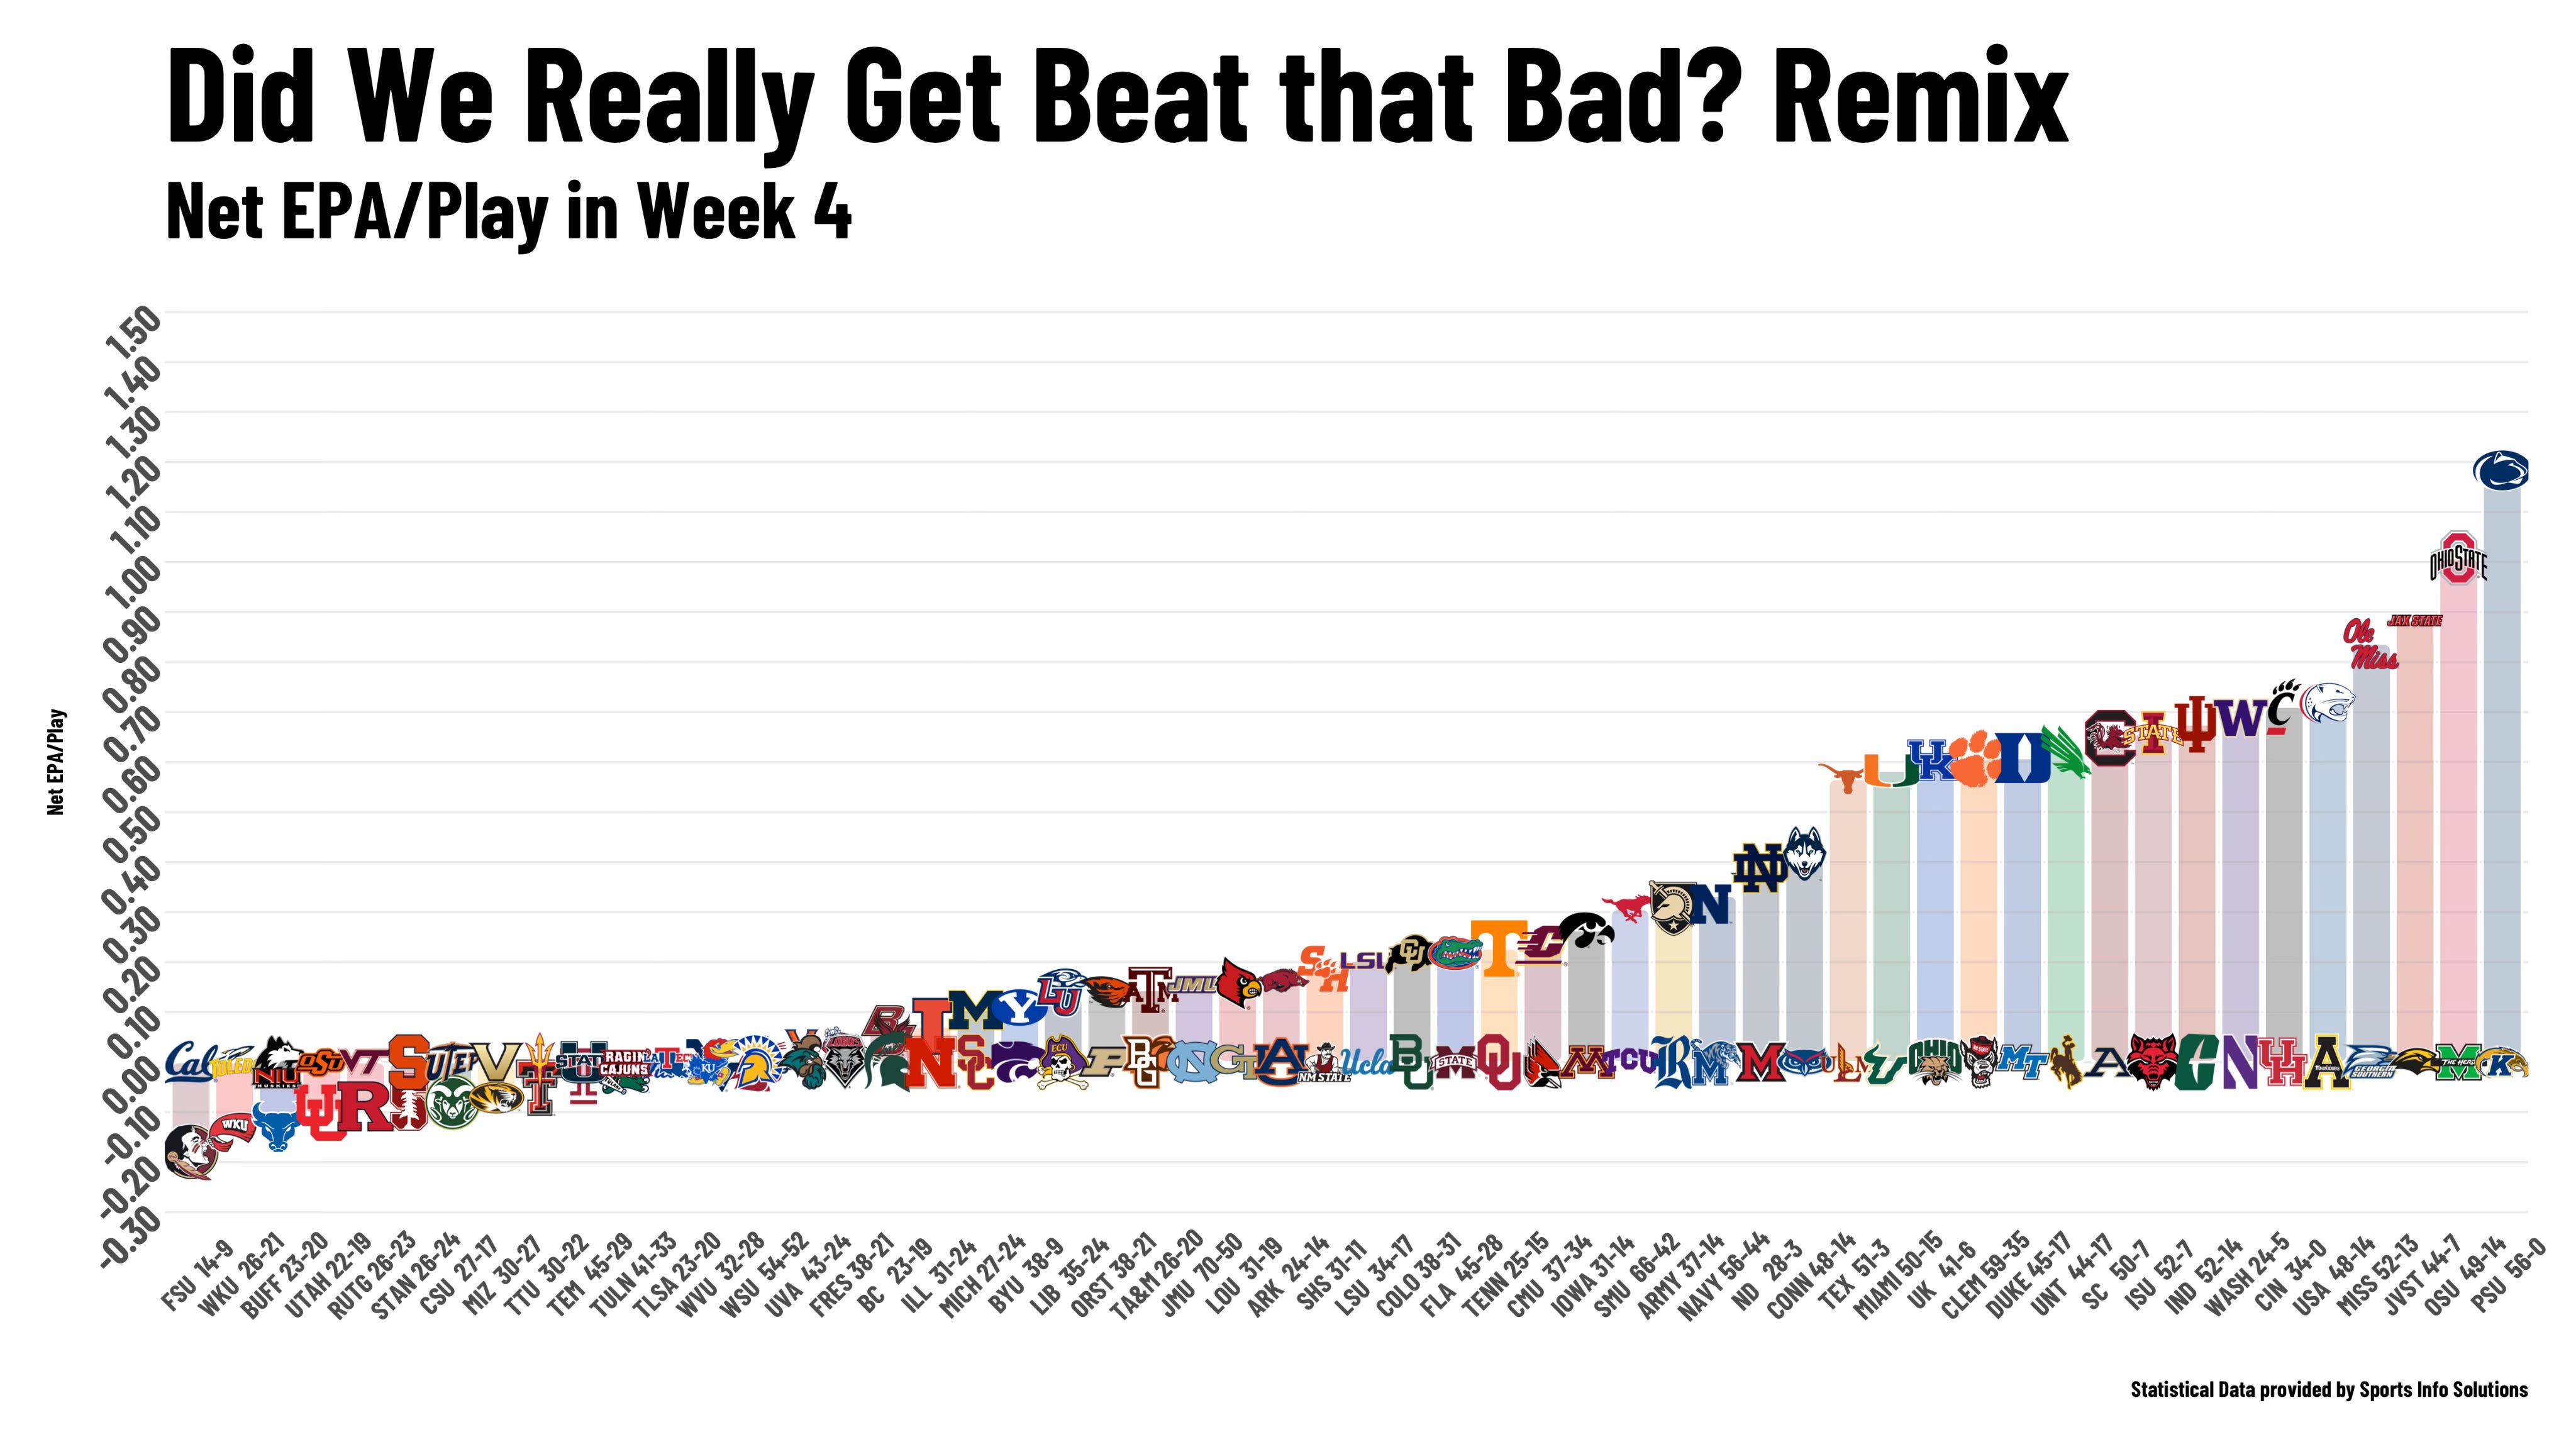
In each chart, every FBS vs FBS game that week is listed, with the losing team at 0.00 on the Y axis. At the far right end are games where the winning team had a large statistical advantage, and at the far left end are games where the winning team had a large statistical disadvantage. In the first chart, the statistic in question is Net Success Rate, and in the second, it is Net EPA/Play.
For those that are new to advanced statistics in football (if you’re not, just skip the next two paragraphs), success rate is the percentage of plays that are successful (obvs), with a successful play being defined as an offensive play that gains: 50% of the yards needed for a first down on first down, 70% of the yards needed on second down, and 100% of the yards needed on 3rd or 4th down. Net success rate is just the difference between two teams’ success rates. Success rate is used to measure a team’s efficiency.
EPA is Expected Points Added. Every down and distance from every yard line on the field has an expected points value - the amount of points the average team would be expected to score given that situation. For some situations, the expected points are negative, meaning the other team is more likely to score next (4th and 10 from your own 20, for example). Expected points added is just the difference in the expected points between the beginning of the play and the end. A good EPA explainer can be found here.
So, back to the first chart. We see that ASU vs Texas Tech is way down on the left end, meaning ASU lost despite having a significant success rate advantage over Texas Tech (48% for ASU vs 39% for Texas Tech). For reference, ASU’s success was quite good (80th percentile), while Tech’s was a little below average (39th percentile). ASU’s offense played a pretty efficient game, while the defense kept Texas Tech’s offense from getting into a rhythm, for the most part.
ASU also had a small EPA/play advantage, as seen in the second chart. The chart only reflects offensive EPA/play - the total EPA of any game will be pretty close to the actual final score margin. So while ASU had an offensive EPA/play advantage over Texas Tech, the total EPA favored the Red Raiders. This means that Texas Tech’s entire EPA advantage came from penalties and special teams (see below).
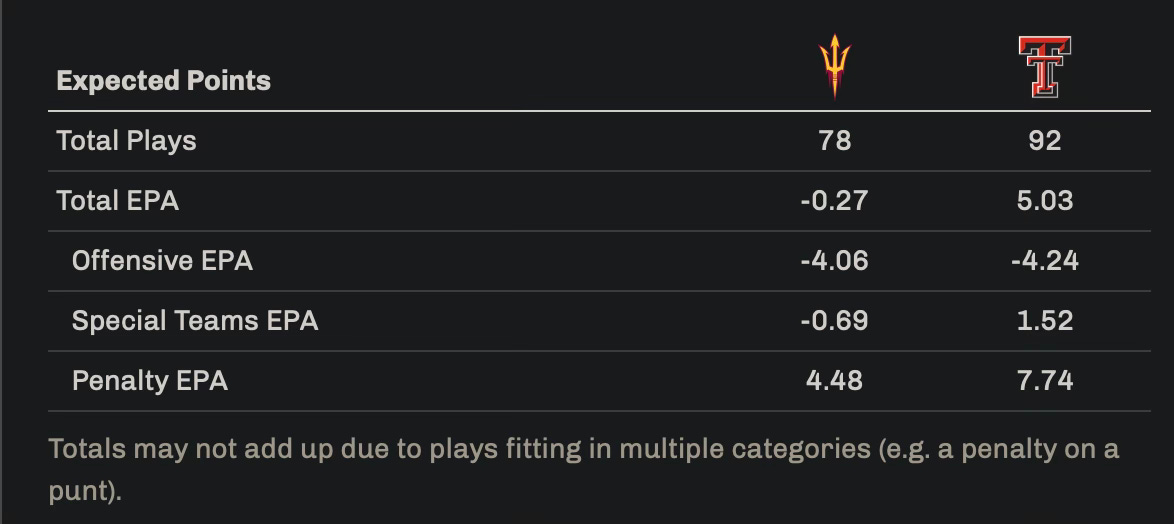
Bottom line: if ASU and Texas Tech were to play that game again, and ASU didn’t kick the ball out of bounds or miss extra points, and didn’t commit a large number of stupid penalties, they would be expected to win the game. This doesn’t mean they didn’t deserve to lose, as special teams and penalties are a real part of the game, but it does indicate that the issue was more themselves, rather than the opponent. If they return to being a fairly disciplined team, and are just average on special teams, they’ll be able to beat teams of Texas Tech’s caliber moving forward.
More on ASU’s success rate: first down runs
While ASU’s offensive success rate was good, as we saw above, it was not good in all facets, particularly on first down runs. The Sun Devils’ success rate broke down as follows:
Overall: 48% (good)
1st down: 50% (good)
1st down pass: 61% (really good)
1st down run: 35% (poor)
Additionally, ASU’s run/pass ratio on first down through the first 3 quarters (they were forced to throw the ball a lot in the 4th quarter due to being behind, so I’m disregarding that) was 56%/44%. This is probably about where Kenny Dillingham wants his offense to be, but it’s a problem when running the ball on first down that much regularly puts the team in second-and-long situations, limiting the offense’s options.
This is especially important with a young quarterback. Throwing the ball is much easier when the defense doesn’t know whether to expect a run or pass, and on second-and-long the defense knows to expect a pass. If I were a coach, and I had a quarterback who was still getting comfortable with the offense and high-pressure situations, I would much rather have him throw the ball in lower-stakes situations where he has the advantage of unpredictability (i.e. first and 10), than in situations where the defense knows what’s coming (second or third and long). The Sun Devils either need to figure out how to fix the run game or be willing to throw the ball on first down more often. I suspect they do a little of both in the games ahead.
Big 12 Power Rankings
Again, this is purely resume-based, but by now, a lot of the weirdness of doing it that way is gone, and it’s getting closer to reflecting who the best teams are.
Utah - Quality road win over OK State puts them on top.
BYU - Big win over K-State. This is one where I don’t think they’ll stay at this position.
Iowa State - Another where this doesn’t reflect where I think they’ll end up, but they’re still undefeated with a road win over a ranked opponent.
UCF - Undefeated and has a conference win on the road.
Texas Tech - Had a good conference win over the weekend.
Kansas State - Lost on the road to BYU, but still has the win over UofA when they were ranked.
Cincinnati - Hammered Houston at home.
Oklahoma State - Lost a big conference game to Utah, but has looked good otherwise.
ASU - Showed some cracks in the loss to Texas Tech. Still well above where many had them projected.
Colorado - Crazy win over Baylor. They’re 3-1 but not super impressive.
UofA - Has not played a game where they looked good yet.
West Virginia - Got a bump for a conference win over Kansas.
TCU - Gave up 66 points to SMU. Ouch.
Baylor - Almost won a conference game on the road, but almost doesn’t count.
Kansas - Super disappointing.
Houston - Got hammered by an ok Cincinnati team. Pretty clearly the worst team in the conference.
Thanks for reading, and let me know what you all think in the comments. Don’t forget to subscribe and share if you like what you saw. See you all next week.
Quality and quick analysis of the game, thank you.