


BYU Recap
What the penalties and turnovers really cost, an analytics breakdown of ASU’s performance, and some thoughts on the team moving forward.

As most of us are well aware by now, ASU lost to BYU 27-17 on Saturday night. It was a very uneven performance by the Sun Devils, as there were moments when they looked like they would take control of the game, interspersed with stretches where they could not get out of their own way, and BYU taking advantage of their mistakes.
ASU was sloppy and undisciplined (not for the first time this season), and seemingly unprepared to play in a loud environment. There were breakdowns in the secondary that resulted in two BYU touchdowns, and multiple plays where ASU’s offense appeared confused about the play call, resulting in Jayden Daniels being unable to execute handoffs to Rachaad White, and having to keep the ball himself. However, the most costly miscues were the 17 penalties for 132 yards and four turnovers committed.
What Did the Penalties and Turnovers Cost?
While it’s impossible to perfectly quantify how many points the penalties and turnovers cost the Sun Devils, as counter-factuals cannot be proven, we’re going to try to at least approximate the cost to demonstrate just how much of an impact they had on the game, and EPA (expected points added) is going to help us do it. As noted in the first The Smart Sun Devil newsletter, EPA uses expected points to measure the outcome of a play. Each yard line is assigned a point value based on the number of points a team would be expected to score from that position on the field, given the down and distance. EPA is the expected points at the beginning of the play subtracted from the expected points after the play. This way we can calculate the points that ASU would be expected to lose as a result of each penalty or turnover. For example, if ASU has a first-and-10 from the 50 yard line, the expected points value of that down-and-distance at that field position is about 3.0, and then if ASU commits a holding penalty, the expected points value of a first-and-20 from their own 40 yard line is about 2.2, then the EPA of that penalty is -0.8 (2.2 - 3.0). It’s important to remember that this stat is predictive - it doesn’t take into account what the actual result of the penalty was (for example, if ASU threw a 60-yard touchdown pass immediately after the penalty, the actual cost of the penalty was nothing), it just identifies how many points, on average, a 10-yard penalty on that down-and-distance from that spot on the field costs an offense.
Thanks to our friends at CFB Numbers, the total expected points added (or lost, in this case) of ASU’s penalties and turnovers against BYU was -17.58 (-11.18 on penalties, and -6.395 on turnovers). This means that on average, the penalties and turnovers ASU committed on those down-and-distances from those spots on the field would be expected to cost a team more than 17 points. That’s an incredible number, especially in a game decided by 10 points and in which ASU, in certain areas, outplayed BYU.
Despite that incredibly large negative EPA number, it should be even higher. Because each team committed a turnover on the interception and fumble by Merlin Robertson in the third quarter, it was actually a positive EPA play for ASU; BYU had a first-and-10 from ASU’s 26 yard line before the play, and a first-and-10 at their own 15 yard line after the play, a negative EPA event for BYU. However, if we could split that play into two separate events (an interception by ASU returned to the BYU 15 yard line, and a fumble by ASU recovered by BYU at their own 15 yard line), it would be one large negative EPA event for BYU, and a large negative event for ASU. The EPA for the ASU fumble would be about -5, as the expected points for a first-and-10 at the opponent’s 15 yard line is approximately 4.5, and for an opponent’s first-and-10 at their own 15, it is about -0.5. This would push the total EPA of ASU’s penalties and turnovers beyond -22. You don’t win many football games making crucial errors that cost you more than three touchdowns.
Now that we know what the cost of the mistakes was in terms of EPA, let’s take a look at the actual results of each penalty and turnover to try and get an idea of what the actual cost was (if a penalty is not listed, it was inconsequential):
Turnover #1: Geordon Porter fumbles the opening kickoff, and BYU recovers at the ASU 12 yard line. This leads directly to a BYU touchdown.
Penalty #2: False start on fourth-and-one at BYU’s 42. ASU is then forced to punt. This penalty killed a drive in BYU’s territory.
Penalty #3: Ineligible man downfield on a first-and-ten from BYU’s 32 that nullified a 29-yard pass to Curtis Hodges down to BYU’s three yard line. ASU later punted. This penalty almost certainly cost ASU points, probably a touchdown.
Turnover #2: On a second-and-eight from BYU’s 19, the Cougars intercept a pass that was not caught cleanly by Curtis Hodges. This probably cost ASU at least a field goal.
Penalty #4: Holding on a kickoff return by ASU. This cost the Sun Devils 23 yards in field position. ASU goes three-and-out, and BYU scores a touchdown on their ensuing possession.
Penalty #5: Intentional grounding on Jayden Daniels on a second-and-one from the BYU 47. This was a bad play by Daniels, as he had enough time and space to at least escape the pocket or place a pass in the vicinity of a receiver. Results in a third-and-12, rather than a third-and-one. ASU threw an interception on the next play.
Turnover #3: Jayden Daniels throws an INT on third-and-12 from the ASU 42. While it was a poor throw (Daniels overthrew Andre Johnson badly over the middle), it wasn’t the most consequential turnover, as it was effectively a short punt. Probably cost them 10-20 yards in field position.
Penalties #9 & #10: Holding on John Stivers on first-and-10 from the BYU 14, and on first-and-15, a false start on Ben Scott. ASU ends up settling for a field goal, so these penalties possibly cost them four points.
Turnover #4: The aforementioned interception and fumble by Merlin Robertson. The fumble very likely cost ASU points, as it would have been first-and-10 at BYU’s 15 had he not fumbled.
Penalties #12-#15: Four false starts over a 5-play stretch deep in ASU territory eventually result in a second-and-long on which Jayden Daniels is sacked. The Sun Devils fail to convert the ensuing third-and-very-long. This was an important possession in the middle of the fourth quarter with ASU trailing by four, 21-17.
Penalty #16: Face mask on Omar Norman-Lott on a one-yard run by BYU on a second-and-six. This gave BYU a first down instead of a third-and-five. BYU goes on to score the game-sealing touchdown.
In summary, three of the four turnovers almost certainly cost ASU points (possibly touchdowns on all three), two penalties cost ASU red zone chances, two other penalties killed ASU drives in BYU territory, a series of penalties stalled an important possession in a crucial point in the game, one penalty extended a BYU drive that ended in a touchdown, and one had significant field position implications that preceded a BYU touchdown. This is just a huge number of points-costing plays that cannot be overcome against even mediocre teams.
Analytics Breakdown
Here’s the advanced box score, again provided by CFB Numbers:
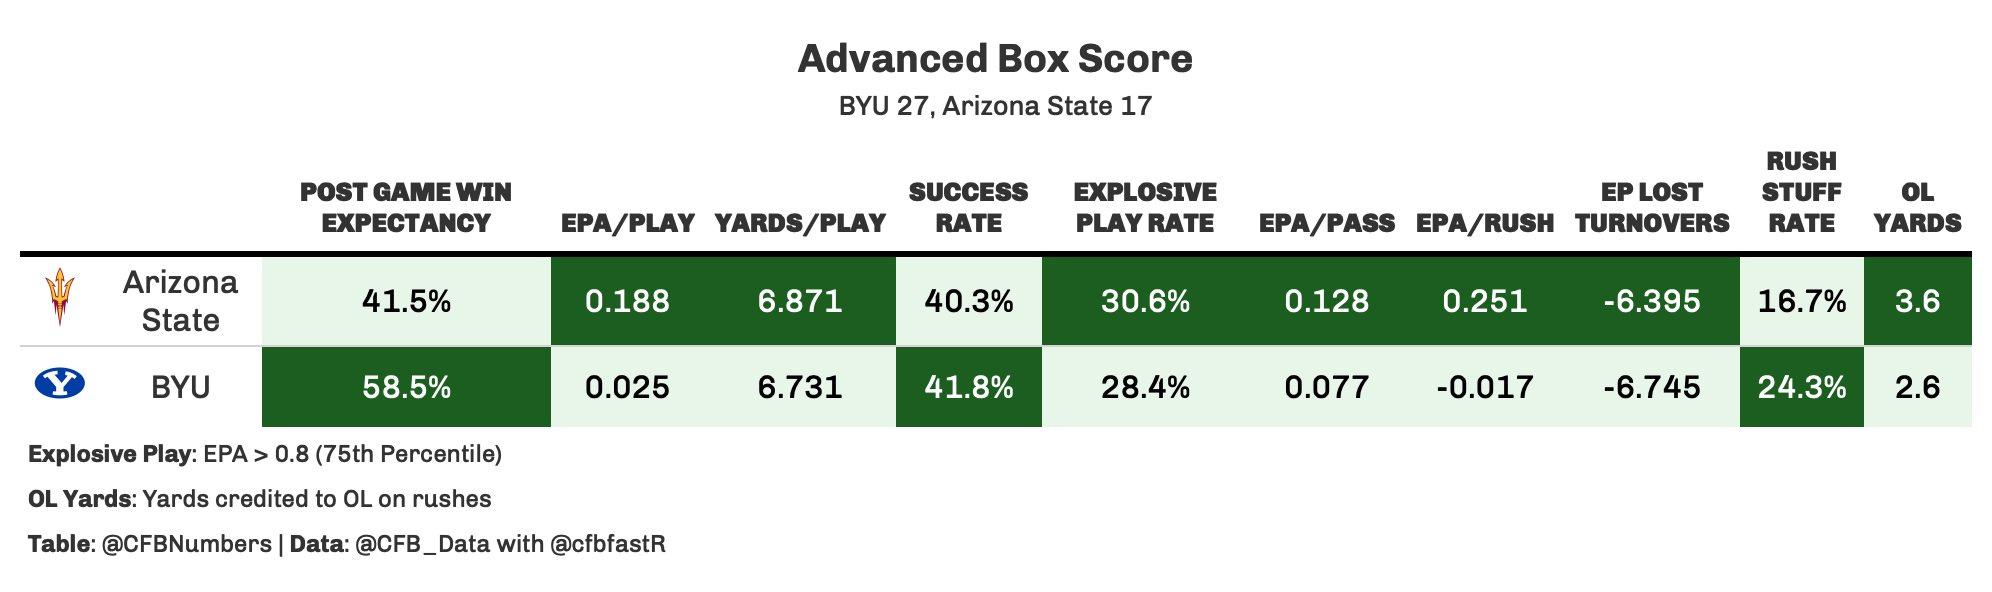
First, a Post Game Win Expectancy stat has been added to the box score. This is the probability that each team would win, given the other stats in the game. We can see that despite all of ASU’s penalties and turnovers, BYU probability of winning did not far exceed ASU’s.
That’s because, excluding those miscues, ASU pretty substantially outplayed BYU. ASU had a large advantage in EPA/play, both running and passing. A .188 team EPA/play is almost an 80th percentile performance. ASU moved the ball effectively against a pretty good BYU defense. However, the success rate of 40.3% and explosive play rate of 30.6% indicate that the offense lacked efficiency, and moved the ball in chunks instead.
ASU’s defense also performed quite well, especially against the run. BYU’s team EPA/play of .025 was an average performance (almost exactly in the 50th percentile). On average, each BYU run play (run EPA/play of -.017) made it less likely that BYU would score next, and ASU stuffed 24.3% of their runs for a loss or no gain. BYU also had a healthy explosive play rate, however, with ASU’s secondary breakdowns contributing to that.
We actually saw ASU be successful at things that were question marks coming into the game. The defense shut down a good team’s run game despite having some lapses against inferior opponents in prior weeks, and the offense successfully threw the ball downfield after struggling to do so before. However, the things that ASU struggled with were also foreshadowed in previous games, with sloppiness and lack of discipline being a huge problem in game one, and a few coverage breakdowns in the secondary in both prior games.
As for Jayden Daniels, here is the QB box score from the game:
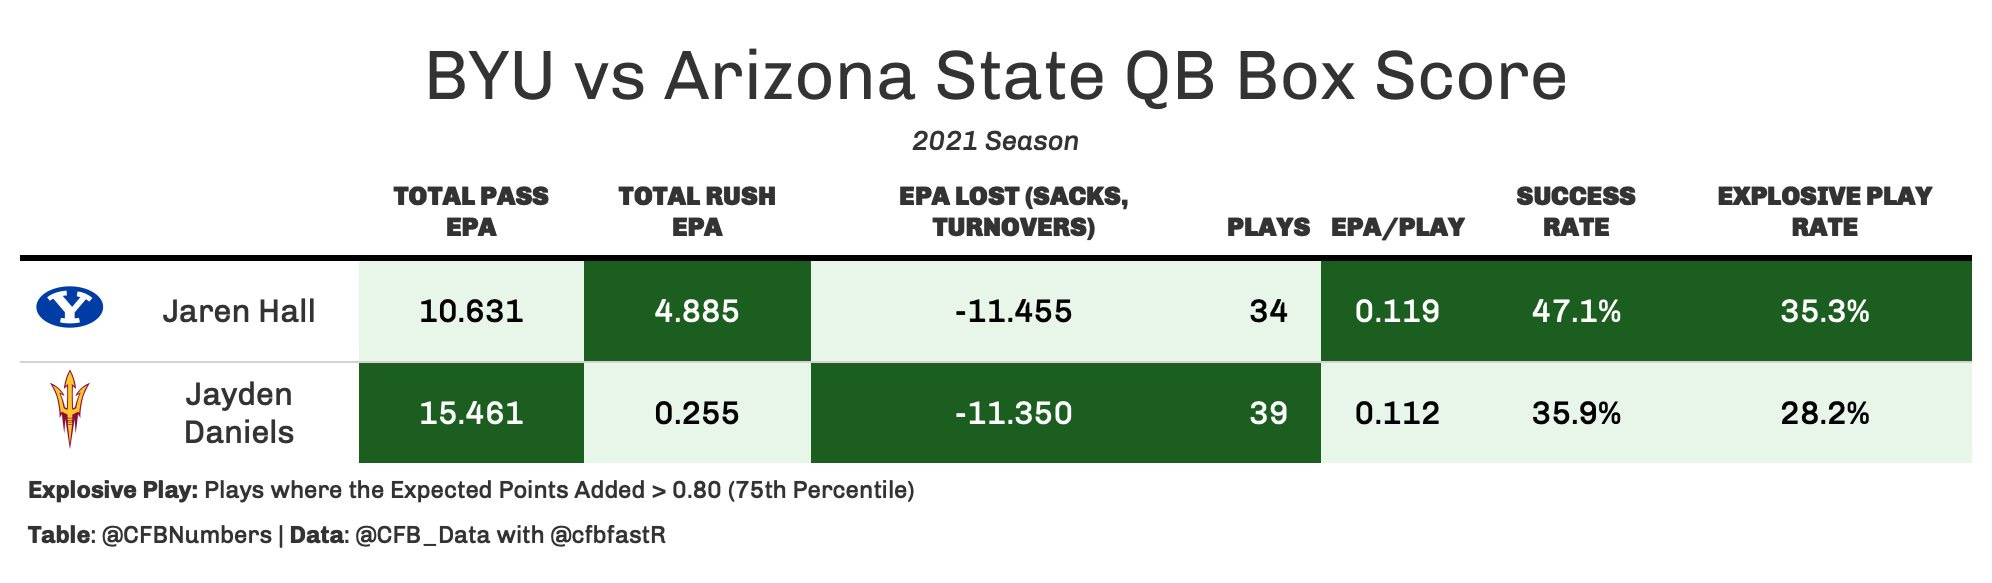
Both quarterbacks had slightly above-average performances. Daniels, however, lacked efficiency, with a success rate of only 36%; both his previous games’ success rates were above 50%. He did make some some plays with his arm and was generally pretty accurate. His traditional stat line was 21-29, 265 yards, 9.1 yards/attempt, 0 touchdowns and 2 interceptions. One interception was a poor throw, and the other was an accurate pass that the receiver failed to catch cleanly (noted above).
What really hurt his performance, however, was his inability to keep himself and the team composed in a hostile environment. There were the several plays where either he or Rachaad White were confused about the direction of the play, failing to execute handoffs, and while the multiple false starts weren’t directly his fault, his communication skills are at least partially to blame.
For a pretty good summary of these problems, see Chris Karpman’s Twitter thread below:

You can also check out his more detailed breakdown on ASU’s execution problems here.
Conclusions
At this point, it’s quite clear that ASU’s sloppiness and lack of discipline are a part of this team’s personality, and will take some work to overcome. They are a pretty experienced team that shouldn’t be making these errors repeatedly. Additionally, it’s apparent that it’s at least partially due to the coaching staff’s approach, as ASU has finished 100th, 97th and 69th in penalties per game the last three years, after regularly being among the best in the nation under previous coach Todd Graham. However, there are also signs that this team is capable of good things if it does manage to clean up the errors. Additionally, the PAC-12 South division appears to be wide open, as all six teams have looked very beatable this year. If the coaching staff is willing to alter their approach and the players are receptive, there is still hope for a good season. However, these are big ifs, and if the status quo is maintained, or if there are only marginal improvements made to the team’s discipline, there may be several more losses on the horizon.
Question of the Day:
What or who do you think is most responsible for ASU’s undisciplined play? Do you think it’s correctable, and if so, to what degree?