


Welcome to The Smart Sun Devil!
What to expect from this newsletter, a season preview, a review of the Southern Utah game, a primer on EPA (expected points added), as well as a preview of this week’s matchup against UNLV.

Hey Sun Devil fans! First, thanks to those who have subscribed to The Smart Sun Devil! Every week, this newsletter will cover Arizona State football with a focus on stats (often of the advanced sort), schemes, and strategy. If you haven’t subscribed yet, please hit the button below and subscribe today so that you don’t miss anything. It’s free - you just have to put in your email address.
What to Expect
Each newsletter will cover a variety of topics:
A review of the previous week’s game, including an analysis of the advanced stats, getting you beyond what the scoreboard says and toward a real understanding of how the Sun Devils actually played. There will also be breakdowns of important plays, identifying what went right (or wrong), and what players and coaches were seeing.
An advanced stats-oriented preview of the coming week’s game. We’ll do a deep dive on the upcoming opponent’s strengths and weaknesses, and how they match up with the Sun Devils.
I have not decided if I’m going to do one long newsletter, or two shorter ones each week. This week, the prior-game review and coming-game preview are combined. However, I may choose to split them up in the future.
Anything else I feel like covering. This newsletter is a work in progress, and will inevitably evolve as time goes on. When there’s important stuff going on in the world of Sun Devil football, I’ll probably have some thoughts and opinions, which I’ll share here.
What this newsletter is not: I’m not a reporter, and I won’t break any news. I’m trying to fill a niche, and guys like Chris Karpman at SunDevilSource.com and Doug Haller at The Athletic do a great job of covering the Sun Devil football beat. There is, however, a dearth of advanced stats-oriented analysis of ASU football, and that’s what I’ll try to provide here.
Season Preview
Since this is the first newsletter of the season, you’re also getting a season preview. There are high expectations for the Sun Devils this year. They are an experienced team; every starting player on the offensive side of the ball has starting experience (Frank Darby and Cade Cote are the only 2020 starters who moved on, and their replacements have started games before), and prior the Jermayne Lole’s season ending injury (torn triceps), the entire 2020 starting defense was back, and Lole’s replacement, Shannon Forman, has starting experience as well. Per Bill Connelly, ESPN’s college football advanced stats guru, the Sun Devils return 95% of their 2020 production, the 4th highest percentage in FBS.
The 2021 Sun Devils are also a fairly talented team. By my count, there are 22 players on the 2021 roster that were rated 4-stars or higher by 247Sports when they came out of high school (16 of those are from the last two classes, 2020 and 2021). There are four players who were first or second-team all-conference in 2020 who are back: Dohnovan West on offense, Chase Lucas and Tyler Johnson on defense, and DJ Taylor on special teams (ASU only played four games in 2020, which probably prevented them from having more all-conference players). Additionally, Case Hatch returns, who made the all-conference team on special teams in 2019. In the 2021 pre-season all-conference team voted on by the media, nine Sun Devils were selected: West to the first-team offense, Kellen Diesch, Jayden Daniels and Rachaad White to the second-team offense, Jermayne Lole (out for the season) and Lucas to the first-team defense, Johnson and Evan Fields to the second-team defense, and Taylor to the second-team on special teams. There are several other additional players who, by my estimation, are decent shots to make the all-conference team at season’s end: Henry Hattis (OL) and Chip Trayanum (RB) on offense, and DJ Davidson (DT), Darien Butler (LB), Kyle Soelle (LB), and Jack Jones (CB) on defense. That’s a total of 13 players who have reasonably good chances to be all-conference performers.
Arizona State starts the year ranked 25th in the AP poll, and unranked, but receiving votes in the USA TODAY Coaches Poll (they received the third-most votes in that category, effectively ranking them 28th). They are ranked 22nd in Bill Connelly’s pre-season SP+ rankings, 29th in ESPN’s FPI (Football Power Index) rankings, 29th in Brian Fremeau’s (of Football Outsiders) FEI rankings, and 25th in the FP+ rankings (a combination of FEI and SP+) at Football Outsiders. This gives us a pretty good idea of what a mix of national media and statistical models1 project ASU to be: a borderline top-25 team.
In the PAC-12 pre-season media poll, ASU is predicted to finish 3rd in the South Division, behind USC and Utah. I believe that ASU would have placed higher here, if not for the news of the pending NCAA investigation that broke over the summer. There was a fair amount of media chatter about the Sun Devils being a dark horse conference title contender prior to that news coming out. I’m not going to go into the details of the NCAA investigation here, as there’s plenty to read about it over at other outlets. You can read Pete Thamel’s report over at Yahoo Sports, and Doug Haller and Chris Karpman have reported on it extensively over at The Athletic and SunDevilSource.com, respectively.
As for win-total projections, SP+ projects 8.3 total wins and 4.9 conference wins, and FPI projects 7.9 total wins.
My Predictions: I think the Sun Devils are a pretty good team, and while I believe the NCAA investigation will have a negative impact on the season, as long as there are no additional significant events regarding the investigation during the season (assistant coaches Adam Breneman, Chris Hawkins and Prentice Gill have already been placed on administrative leave), I think the impact will be moderate-to-small. I project them to go 9-3 overall and 6-3 in conference, finishing second in the South Division. Had there been no investigation and no season-ending injury to Jermayne Lole, I likely would have predicted 10-2 overall and 7-2 in conference, finishing first (or tied for first) in the South Division.
Here’s the methodology for how I arrived at my season record prediction: like the statistical models, I assign a probability of an ASU victory to each game, then sum the probabilities to get a win total. The only difference is that my probabilities don’t come from a computer, just my head.
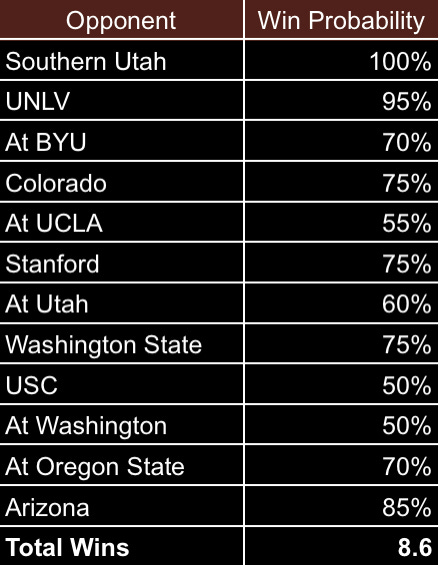
I rounded 8.6 up to 9. Additionally, each of the probabilities were assigned prior to week one, so those results are not factored into this projection. If I were to take into account week one results, I’d bump up the win probabilities for the games against Washington and Stanford, and bump down the probability for UCLA. The net difference would be an increase in total wins for ASU, but only by a few decimal points, leaving the predicted wins at 9.
Additionally, here are my five most likely records, in order:
9-3
8-4
10-2
7-5
6-6
My top three reflect my belief that this is a good team who, if the breaks go their way, could compete for the conference championship. I also believe there’s a non-zero chance that there is additional distraction from the NCAA investigation, including the possibility of additional coaches being put on leave, and that this could affect team morale and derail the season.
There are many Sun Devil fans who are very optimistic about this season and believe that a South Division title, and/or a conference championship are to be expected this season, and anything less would be a disappointment. I don’t see myself, given the current power balances in the conference, ever going into a season expecting ASU to win the conference. There are just too many teams in the PAC-12 who have more resources and talent than ASU for me to believe that they are the team most likely to win the conference. In good seasons, however, they could be in the mix, and I think 2021 has the potential to be a good season.
Southern Utah Game Review
The Sun Devils beat Southern Utah on Thursday night, 41-14. It was, at times, an ugly game, filled with penalties and special teams mistakes. However, there were bright spots, and ASU clearly dominated an inferior team (Southern Utah is an FCS team who went 1-5 in the Big Sky conference last spring).
It was also a weird game, especially in regard to how many offensive plays ASU was able to run. The Sun Devils ran only 22 plays in the first half, and 58 plays total, well below Coach Herm Edwards’ stated goal of 70+ plays per game. Per teamrankings.com, there were 94 FBS teams who have played in games against other FBS teams this year (since ASU has only played an FCS team, they’re not included). ASU’s 58 plays would have ranked them 89th out of the 94. Since they ran so few plays, it’s useful to look at per-play statistics, rather than game totals or points scored, to assess how effective the Sun Devil offense was. Additionally, since this was a game against such an inferior FCS opponent, much of the second half would be considered garbage time2, so we’re going place special focus on the first half stats.
The Sun Devils gained 239 yards on their 22 plays in the first half, an average of 10.86 yards/play. This is exceptional, and for reference, if they had continued that pace throughout the game, it would have been the highest yards/play of any team in week one. Also, if we extrapolate these numbers out to a full game where ASU ran 70 plays (Herm’s target, and a more average number of plays for a game like this), and assume that about 45 of those plays were pre-garbage time, and that ASU’s garbage time yards/play decreased to 5, they would have eclipsed 600 total yards for the game, and would have easily scored 50+ points. So for those concerned that ASU “only” scored 41 points against a poor FCS team, that low point total was largely due to the exceptionally low number of plays ASU ran, especially in the first half (when they would have had their foot on the gas), and not due to the offense performing below expectations.
None of this is to say that ASU’s performance was without flaws. The penalties (13 for 135 yards) were bad and the special teams performance was concerning. One of the reasons that the Sun Devils ran so few plays in the first half was that they lost a possession on the pop-up kickoff that SUU recovered, which was their own fault. These are things to keep an eye on as the season goes on, as this level of sloppiness could cost them games in the future. However, the penalties are fixable, and ASU is likely to get Cristian Zendejas back within the next few games (he had announced he was transferring out earlier in the year, but this week announced that he was returning to the team), which will help the special teams situation, as the field goal/extra point kicking was most glaring problem.
Expected Points Added (EPA) and JD5’s Performance
Another way to look at ASU’s performance is through Expected Points Added, and advanced metric that measures the point value of an individual play. From collegefootballdata.com:
Expected Points (EP) assumes that not all yard lines are created equal. In other words, each yardline is assigned a point value and measures the number of points that would be expected to be scored based on down, distance, and field position. A negative value means that the opposing team would be expected to score the next points in the game.
Expected Points Added (EPA) uses Expected Points to measure the outcome of a play. It takes the EP value from the beginning of a play (e.g. 2nd and 5 at the 50) and subtracts it from the EP value resulting from the play (e.g. rush for 10 yards results in 1st and 10 from the 40).
Here is ASU’s advanced box score, which includes EPA/play, from our friends at CFB Numbers:

We can see that ASU’s EPA/play was .266. Is that good? It’s hard to conceptualize what a good EPA/per play would be, so CFB Numbers also produced this handy graphic to help out:

So if we find .266 on the vertical axis, then follow that over to the right, we see that an EPA/play of .266 is in about the 85th percentile - a good performance for the ASU offense. Additionally EPA/play includes penalties, so if ASU had had a cleaner performance in that regard, its EPA/play would have been even higher. This is exactly the type of performance we would expect from a good team going against an inferior opponent.
Let’s discuss the other items from the advanced box score. We know what yards/play is, and 8.228, while lower than the first-half-only number noted above, is still exceptional. Success rate3 is the percentage of plays that were successful, and 64.9% is a really good number. Explosiveness is the EPA/play of successful plays. Here, 1.20 is a good, if not exceptional, number (for reference, Ohio State had an explosiveness metric of 1.53 in their game against Minnesota this week). A good way to think about success rate and explosiveness is that a team with a high success rate and a low explosiveness would have consistently marched down the field on small-to-medium gains without breaking any big plays, and a team with a low success rate and a high explosiveness would have frequently gotten stuffed for losses or short gains, but hit on several big plays. What ASU’s success rate and explosiveness tell us is that they were consistently getting pretty good chunks of yards. EPA/pass and EPA/rush are just EPA/play broken out between the pass and rush plays. The rush stuff rate is the percentage of run plays stopped at or behind the line of scrimmage - I would have expected a higher stuff rate for Southern Utah. OL yards is the yards/run play attributable to the offensive line. Here, 4.7 is a really good number for ASU, but 3.1 is a little higher than I would have expected for SUU.
Now let’s move on to Jayden Daniels’ performance. His traditional box score will tell you that he was 10-12 for 132 yards, no TDs and no INTs, with 6 rushes for 40 yards. Especially passing-wise, not an eye-popping performance. Here is his advanced QB box score:
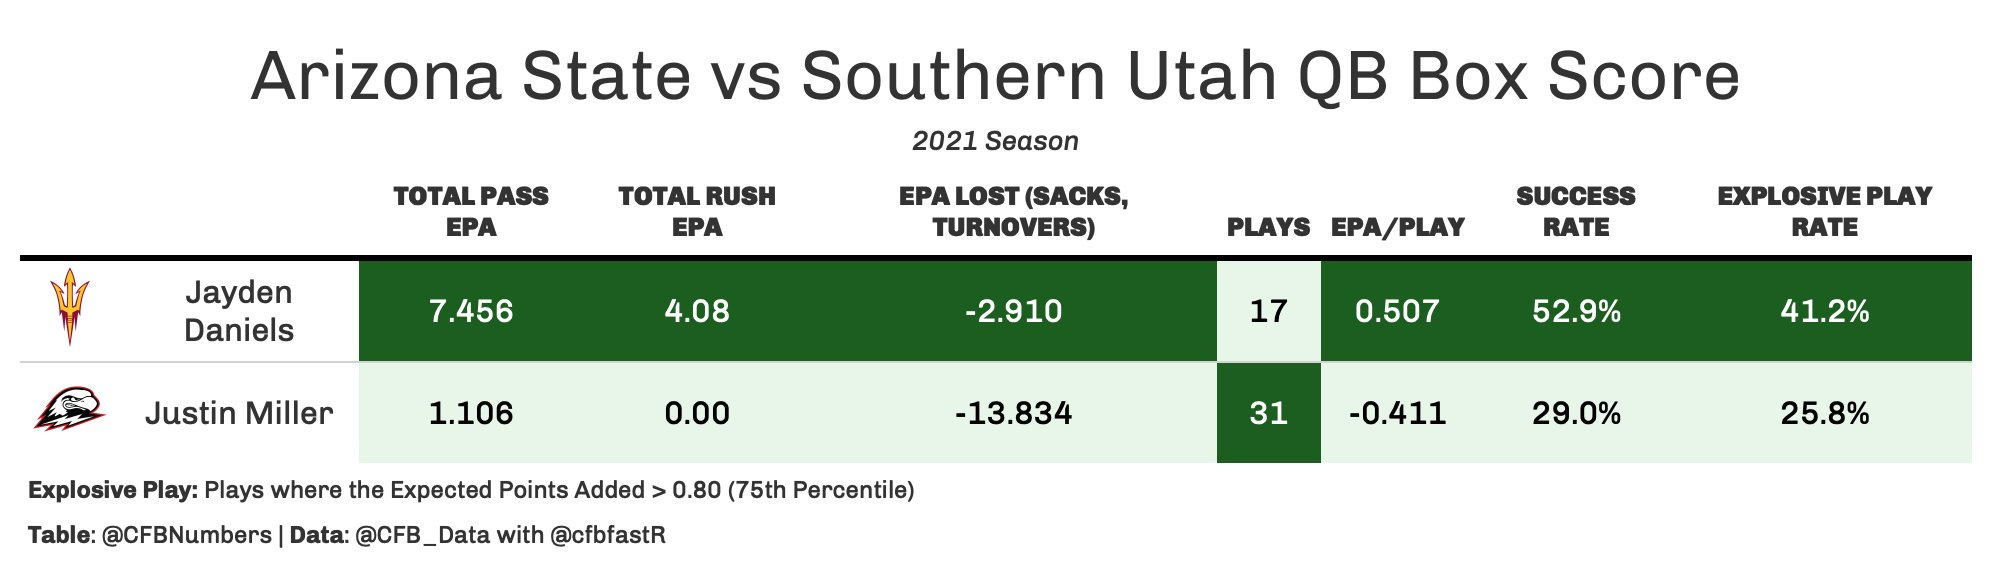
First, we see his total pass, and total rush EPAs, and the EPA lost. These are the cumulative total of the EPAs of all the plays he was involved in. Here, 7.456 is not a good number, but that’s because he was only involved in 17 plays. Typically, he’d be involved in about double that number. The important number is his EPA/play. Again, it’s hard to conceptualize what a good EPA/play is, so we have another graphic to help us out (QB EPA/play is going to be on a slightly different scale than total team EPA):

Using this, we can see that JD5’s EPA/play of .507 puts him just above the 90th percentile - a fantastic performance, and what you would expect from a good quarterback against inferior competition. His success rate and explosive play rate were exceptional, as well.
Why is EPA especially useful? Traditional statistics like yards or even yards/attempt are helpful, but don’t give added weight to plays that matter or have a bigger impact on the game. For example, yards per attempt doesn’t know the difference between a 10-yard completion on 3rd-and-20 from your own 10 yard-line, a 10-yard completion on 3rd-and-8 from your opponent’s 35 yard-line, or even a 10-yard touchdown pass. EPA does know the difference, as each play is assigned an EPA based on down, distance, and location on the field.
It wasn’t all good for Daniels, however. There are some things that our eyes can tell us that even advanced stats cannot. While EPA picks up his sacks, it does nothing to help us know whose fault they were. He was sacked twice in the first half as a result of him fleeing the pocket early despite the fact that his protection had not broken down. One of them was a third down from SUU’s 38 yard-line where he took a sack rather than attempting a pass downfield. In that situation, an INT on a deep pass would have been preferable to a sack, as it would have functionally been no different from a punt. Maintaining his pocket presence in order to find an open receiver after his first read is not open has been something with which Daniels has struggled in the past, so this is something to keep an eye on. A good sign, however, was his final pass of the night, where he escaped the pocket, but kept his eyes downfield and threw a nice pass to LV Buckley-Shelton for a 16-yard gain.
UNLV Preview
As this week’s newsletter includes a season preview and is already getting long, and UNLV is a team that ASU should beat pretty handily, I’ll keep the preview short and simple. ASU is favored by 33 points by the oddsmakers in this one. SP+ projects that ASU would beat UNLV by 29.2 points on a neutral field4, with ASU a full 100 spots higher than UNLV in the rankings (ASU at 21, and UNLV at 121). FPI gives ASU a 95.3% probability of winning.
UNLV lost to FCS Eastern Washington 35-33 at home in week one. They struggled throwing the ball, but improved once they replaced their starter (Doug Brumfield, the replacement, is expected to be the starter against ASU), but did run the ball fairly effectively, with Charles Williams gaining 172 yards on 27 carries. On defense, they gave up 374 yards passing on 9.6 yards/attempt.
This game should not be close, so rather than spend time on why and how ASU will win this game, I think it’s better to identify a few important things to watch for:
Does ASU clean up the penalties and special teams sloppiness? It would be good to see less than 60 yards in penalties, and no missed extra points or other special teams guffaws.
How does Jayden Daniels do with his decision-making and accuracy? He should have another efficient game against UNLV. Does he improve his patience in the pocket from the first game?
Does the run game continue to get easy yards? If ASU is going to compete for the conference title, they will need a great run game, as this appears to be the strength of the offense. Against UNLV, they should continue to dominate if this is to be the case.
Does the offense finish drives? Really good teams finish drives, especially against inferior opponents. Also, given how bad the FG unit could potentially be, ASU needs to score touchdowns.
Does the defense improve its focus? When it was dialed in, the D shut down Southern Utah last week. However, there were lapses. That needs to improve this week.
Wrap Up
If you liked what you read here, and haven’t subscribed yet, please hit the button below:
Question of the week:
What do you agree or disagree with on my season predictions, and what are your predictions?
Lastly, a big thanks to CFB Numbers for providing the box scores and graphics. Please visit their site and subscribe:

Pre-season statistical models are generally not as accurate as mid-season ones. The pre-season versions often include prior-season data and other data such as recruiting rankings and returning production. As the season progresses, the weight given to current-season data increases as the other data is phased out. Additionally, any prior-season data for ASU is from their 4-game 2020 season, which may make their ratings less accurate than those of teams who played full schedules (or almost full) in 2020.
Bill Connelly defines garbage time as a when a game is not within 38 points in the second quarter, 28 points in the 3rd quarter, or 22 points in the 4th quarter. In my observation, Herm Edwards is more conservative than the average coach, and I’m making the assumption that he assumed the game was in garbage time once ASU took a 34-7 lead in after their first possession of the 3rd quarter.
A successful play is defined as any play in which the offense scored, a first down where 50% of the yards to go were gained, a second down where 70% of the yards to go were gained, or a third or fourth down where 100% of the yards to go were gained.
SP+, as well as other ratings systems, is presented as an adjusted points-per-game figure. This means that the rating represents how many points better a team is than the average team on a neutral field. ASU’s SP+ rating is 13.1, while UNLV’s in -16.1. This means ASU would be projected to beat UNLV on a neutral field by 29.2 points.